Tag Archives: death

1999: Funeral Participation And Type Of Death As Factors In Bereavement

The Relationship Of Cause Of Death To Attitudes Toward Funerals And Bereavement Adjustment examined how multiple factors might combine to affect the bereaved. Whether someone died suddenly, or after an illness, whether they were close or distant, and other circumstances of death would seem likely to influence how survivors adjust to the loss. Funeral activities have also been suggested as factors affecting participants’ later adjustment. The researchers used multivariate analysis to explain how various factors combine to affect mourning.1

Subjects: 438 adults who had experienced the loss of a family member or friend within two years (90% had occurred within one year). Average age of subjects: 35.

Main findings

When the person’s death was expected, survivors tended to have better bereavement adjustment.

When the death was expected, and the mourner was emotionally close to the deceased, they saw the funeral as more meaningful and they participated more in post-funeral activities.

For older bereaved persons, the type of death did not have as big an impact on how well they adjusted, or how much they participated in the funeral rituals.

People whose loved ones died from violent, sudden, or stigmatized causes had the worst grief and bereavement adjustment overall, and received the lowest levels of social support. These mourners do get more involved in the early stages of the funeral process, which may be beneficial for them. But the study does not show better adjustment for such bereaved persons as a result of funeral participation.

Regarding type of death:

Continue reading 1999: Funeral Participation And Type Of Death As Factors In Bereavement
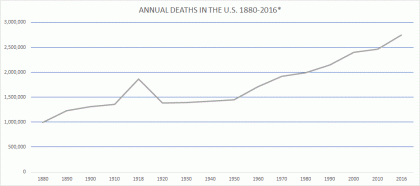
U.S. Mortality Totals During The Funeral Industry’s Early Years

From this picture of the past and future, what can we learn about the the funeral market in the United States?

(*1880-1930, death registration area death rate applied to total U.S. population count. See below.)

Throughout human history, changes in the big picture environment of a group of people have often led to changes in the way those people live. Changes in social structure leading to changes in culture. Macro affecting micro.

Population increases and decreases would be quintessential examples of the big picture. If a bunch of people start moving into a neighborhood, or leaving, people within that area might end up doing things differently.

An institution like whichever one happens to handle the dead within a given society, being very population-dependent, can be susceptible to changing when there are major demographic shifts. This seems like an obvious sort of observation, but it hasn’t been explored much, especially in the modern context.

Patterns emerge from changes in death totals that should be of interest to anyone concerned with the funeral business, not least of all people working in that industry.

It will take more than a few posts to tell this story, but a key part can be explained very simply by showing what sort of market the first few generations of American funeral directors inhabited.

To skip ahead briefly, however: I will point out that the American funeral industry took shape in the second half of the nineteenth century, first in some of the larger eastern cities, and had become dominant throughout the entire U.S. by the beginning of World War II. Some rural areas such as in Appalachia did not have ready access to modern embalming until the early 1940s.1 But for present purposes, I will note that the funeral business was functioning in many of our major population areas from the 1880s onward.

As mentioned in a previous post, we don’t have complete death statistics from before 1933. But we can do a bit of extrapolation using data we do have to get a fuller picture of death in America. In the early years of mortality counting, from 1880 through 1933, the agencies responsible designated a “death registration area” that began with just a few cities but gradually encompassed the entire country.2 The death registration area death rates are shown in the early years of the 1880-2060 chart posted earlier.

I think the death registration area death rates were probably not too far off from the situation in the rest of the U.S. If we multiply those validated death rates by the actual U.S. population totals for those years from the previous post, we get the following:

*Estimated deaths in U.S., 1880-1930, applying death rate from death registration area to total U.S. population
YEAR POPULATION DEATH RATE TOTAL DEATHS*
1880 50,155,783 19.8 993,085
1890 62,947,714 19.6 1,233,775
1900 76,094,134 17.2 1,308,819
1910 92,406,536 14.7 1,358,376
1918 103,202,801 18.1 1,867,971
1920 106,466,420 13 1,384,063
1930 123,076,741 11.3 1,390,767

(I include the out-of-series year 1918 as a matter of interest to show the affect the Spanish flu had, but also because, as a part of the funeral business landscape, 1918 shouldn’t be overlooked).

Let’s take a look at the graph at the top. (Full data list is below):

Continue reading U.S. Mortality Totals During The Funeral Industry’s Early Years

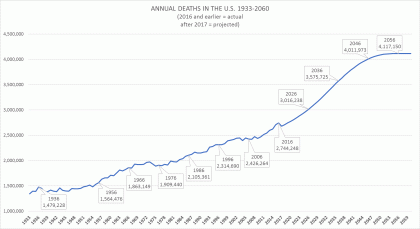
Annual Deaths In The U.S. 1933-2060

Continuing with our data series, the number of deaths each year brings the percentages into a clearer picture.

You can see that for a long stretch of time, even while the U.S. population continued to increase (by how much? Hint: a lot—stay tuned for another chart), the number of people dying each year remained relatively static. Yes, the number of annual deaths increased, but very slowly.

As a side note: the reason I’m beginning this graph in 1933 is because we don’t know the actual death numbers from before that year. It took some time for the entire U.S. to buy into the need to keep such records. As early as the 1880s a few places like Massachusetts and Washington, D.C. kept official death records, but it was a slow process to expand the “death registration area” to encompass all of the nation.

If you look at the beginning on the left and follow the line across, you can see it took almost 70 years, from 1933 to 1999, for the mortality number to increase by a million, and for 10 years after that it barely increased at all. Population growth during the period made that line seem even flatter in terms of number of funerals per capita.

While population increased, and technology made work easier, people died from a lot fewer things, and life in general got better than it had been for the entirety of recorded history, there seemed to be less death occurring around most of us, including around funeral businesses. The latter were not unaffected by this ongoing state of affairs.

Here is a graph of the mortality figures in the United States from 1933 onward, and below it are the data by year.

Continue reading Annual Deaths In The U.S. 1933-2060

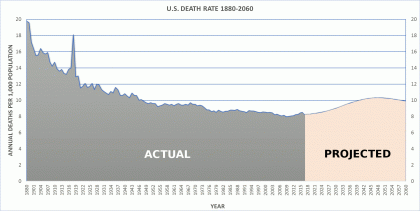
U.S. Death Rate 1880-2060

To understand the funeral industry in America, it’s helpful to know certain facts.

First, how did the industry come to be? Death statistics show us the landscape the industry arose out of, which is a big reason for the role it played for a long stretch of time and, consequently, the types of businesses you will likely deal with if you have to go funeral shopping.

Second, where is the industry headed? Death statistics projections are also very interesting, because they show what the new landscape may look like. For people who think about what sort of funeral industry we will have in the coming years, and therefore what types of businesses we may be dealing with, projections are essential.

Being projections, the data for years after 2016 are hypothetical, of course (it takes a couple years to tally up all of the actual numbers); however, certain fixed realities make the projections reliable.

Chief among these realities is the current macro death rate of 100 percent. Unless they emigrate or teleport away, every single person in America is going to die, and will need to be handled by some type of mortuary agency, and for our species death relates closely to age.

In this and related tables, we will see exactly why the projections are reliable.

Through the course of U.S. history, there have been quirks in the data collection process. I hope to tell that story in the future, but for now the thing to know is we don’t have a continual data record of how many people have died. The data are less certain the further we look back in time. Measures of death rate are probably reasonably accurate going back to the end of the nineteenth century, but the actual mortality count is only really reliable after 1932.

Because of these inconsistencies, the data series I am showing start at different times …. but you will get the picture.

To begin this series of data posts, here is a graph of the death rate in the United States from 1880 onward, and below it are the data by year.

Continue reading U.S. Death Rate 1880-2060