To understand the funeral industry in America, it’s helpful to know certain facts.
First, how did the industry come to be? Death statistics show us the landscape the industry arose out of, which is a big reason for the role it played for a long stretch of time and, consequently, the types of businesses you will likely deal with if you have to go funeral shopping.
Second, where is the industry headed? Death statistics projections are also very interesting, because they show what the new landscape may look like. For people who think about what sort of funeral industry we will have in the coming years, and therefore what types of businesses we may be dealing with, projections are essential.
Being projections, the data for years after 2016 are hypothetical, of course (it takes a couple years to tally up all of the actual numbers); however, certain fixed realities make the projections reliable.
Chief among these realities is the current macro death rate of 100 percent. Unless they emigrate or teleport away, every single person in America is going to die, and will need to be handled by some type of mortuary agency, and for our species death relates closely to age.
In this and related tables, we will see exactly why the projections are reliable.
Through the course of U.S. history, there have been quirks in the data collection process. I hope to tell that story in the future, but for now the thing to know is we don’t have a continual data record of how many people have died. The data are less certain the further we look back in time. Measures of death rate are probably reasonably accurate going back to the end of the nineteenth century, but the actual mortality count is only really reliable after 1932.
Because of these inconsistencies, the data series I am showing start at different times …. but you will get the picture.
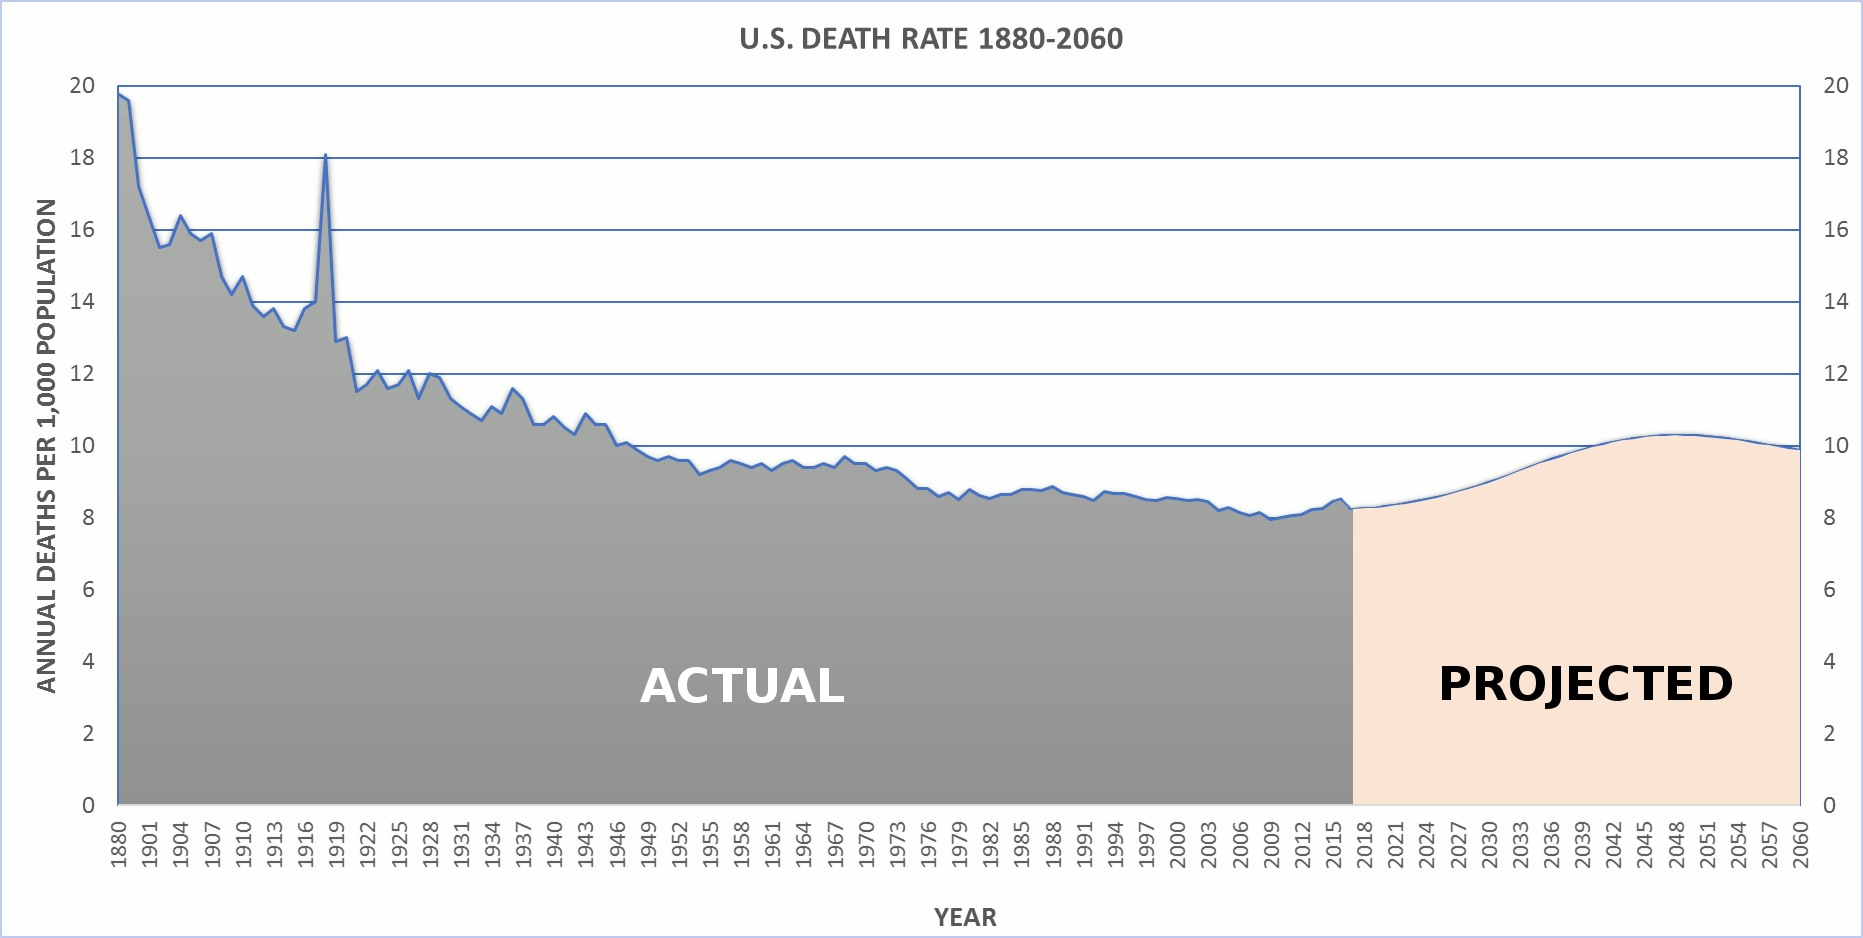
To begin this series of data posts, here is a graph of the death rate in the United States from 1880 onward, and below it are the data by year.
| Year | Death Rate |
|---|---|
| 1880 | 19.80 |
| 1890 | 19.60 |
| 1900 | 17.20 |
| 1901 | 16.40 |
| 1902 | 15.50 |
| 1903 | 15.60 |
| 1904 | 16.40 |
| 1905 | 15.90 |
| 1906 | 15.70 |
| 1907 | 15.90 |
| 1908 | 14.70 |
| 1909 | 14.20 |
| 1910 | 14.70 |
| 1911 | 13.90 |
| 1912 | 13.60 |
| 1913 | 13.80 |
| 1914 | 13.30 |
| 1915 | 13.20 |
| 1916 | 13.80 |
| 1917 | 14.00 |
| 1918 | 18.10 |
| 1919 | 12.90 |
| 1920 | 13.00 |
| 1921 | 11.50 |
| 1922 | 11.70 |
| 1923 | 12.10 |
| 1924 | 11.60 |
| 1925 | 11.70 |
| 1926 | 12.10 |
| 1927 | 11.30 |
| 1928 | 12.00 |
| 1929 | 11.90 |
| 1930 | 11.30 |
| 1931 | 11.10 |
| 1932 | 10.90 |
| 1933 | 10.70 |
| 1934 | 11.10 |
| 1935 | 10.90 |
| 1936 | 11.60 |
| 1937 | 11.30 |
| 1938 | 10.60 |
| 1939 | 10.60 |
| 1940 | 10.80 |
| 1941 | 10.50 |
| 1942 | 10.30 |
| 1943 | 10.90 |
| 1944 | 10.60 |
| 1945 | 10.60 |
| 1946 | 10.00 |
| 1947 | 10.10 |
| 1948 | 9.90 |
| 1949 | 9.70 |
| 1950 | 9.60 |
| 1951 | 9.70 |
| 1952 | 9.60 |
| 1953 | 9.60 |
| 1954 | 9.20 |
| 1955 | 9.30 |
| 1956 | 9.40 |
| 1957 | 9.60 |
| 1958 | 9.50 |
| 1959 | 9.40 |
| 1960 | 9.50 |
| 1961 | 9.30 |
| 1962 | 9.50 |
| 1963 | 9.60 |
| 1964 | 9.40 |
| 1965 | 9.40 |
| 1966 | 9.50 |
| 1967 | 9.40 |
| 1968 | 9.70 |
| 1969 | 9.50 |
| 1970 | 9.50 |
| 1971 | 9.30 |
| 1972 | 9.40 |
| 1973 | 9.30 |
| 1974 | 9.10 |
| 1975 | 8.80 |
| 1976 | 8.80 |
| 1977 | 8.60 |
| 1978 | 8.70 |
| 1979 | 8.50 |
| 1980 | 8.78 |
| 1981 | 8.62 |
| 1982 | 8.52 |
| 1983 | 8.64 |
| 1984 | 8.65 |
| 1985 | 8.77 |
| 1986 | 8.77 |
| 1987 | 8.76 |
| 1988 | 8.87 |
| 1989 | 8.71 |
| 1990 | 8.64 |
| 1991 | 8.58 |
| 1992 | 8.48 |
| 1993 | 8.73 |
| 1994 | 8.66 |
| 1995 | 8.68 |
| 1996 | 8.59 |
| 1997 | 8.49 |
| 1998 | 8.47 |
| 1999 | 8.57 |
| 2000 | 8.54 |
| 2001 | 8.48 |
| 2002 | 8.50 |
| 2003 | 8.44 |
| 2004 | 8.19 |
| 2005 | 8.28 |
| 2006 | 8.13 |
| 2007 | 8.05 |
| 2008 | 8.13 |
| 2009 | 7.95 |
| 2010 | 8.00 |
| 2011 | 8.07 |
| 2012 | 8.10 |
| 2013 | 8.22 |
| 2014 | 8.24 |
| 2015 | 8.44 |
| 2016 | 8.49 |
| 2017 | 8.23 |
| 2018 | 8.27 |
| 2019 | 8.27 |
| 2020 | 8.30 |
| 2021 | 8.34 |
| 2022 | 8.38 |
| 2023 | 8.43 |
| 2024 | 8.49 |
| 2025 | 8.55 |
| 2026 | 8.62 |
| 2027 | 8.70 |
| 2028 | 8.78 |
| 2029 | 8.87 |
| 2030 | 8.97 |
| 2031 | 9.07 |
| 2032 | 9.18 |
| 2033 | 9.28 |
| 2034 | 9.39 |
| 2035 | 9.50 |
| 2036 | 9.60 |
| 2037 | 9.70 |
| 2038 | 9.79 |
| 2039 | 9.88 |
| 2040 | 9.96 |
| 2041 | 10.03 |
| 2042 | 10.09 |
| 2043 | 10.15 |
| 2044 | 10.20 |
| 2045 | 10.23 |
| 2046 | 10.26 |
| 2047 | 10.27 |
| 2048 | 10.28 |
| 2049 | 10.28 |
| 2050 | 10.27 |
| 2051 | 10.25 |
| 2052 | 10.22 |
| 2053 | 10.19 |
| 2054 | 10.15 |
| 2055 | 10.11 |
| 2056 | 10.06 |
| 2057 | 10.01 |
| 2058 | 9.97 |
| 2059 | 9.92 |
| 2060 | 9.87 |
Sources:
-
U.S. Census Bureau, “Population Changes – National Birth, Death, Migration Projections: United States by Year, Age, Gender, and Ethnicity for Years 2014-2060,” CDC WONDER Online Database, December 2014, http://wonder.cdc.gov/birth-death-migration-ethnicity-projections-2014-2060.html.
-
Centers for Disease Control and Prevention, National Center for Health Statistics, “Underlying Cause of Death 1999-2016,” CDC WONDER Online Database, December 2017, http://wonder.cdc.gov/ucd-icd10.html.
-
Kenneth D. Kochanek et al., “Deaths: Final Data for 2014” (Hyattsville, MD: National Center for Health Statistics, June 2016), 20–21, https://www.cdc.gov/nchs/data/nvsr/nvsr65/nvsr65_04.pdf.
-
National Center for Health Statistics, “Vital Statistics of the United States, 1990: Vol. II, Mortality, Part A” (Washington, D.C.: U.S. Public Health Service, 1994), 1–1, 1–2, 1–3, https://www.cdc.gov/nchs/data/vsus/mort90_2a.pdf.