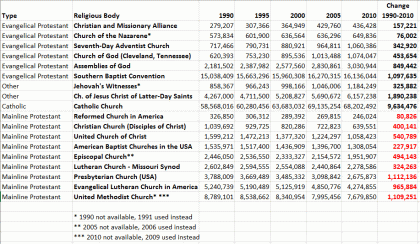
How has membership changed in the largest U.S. religious bodies? The previous post was a bit data-heavy so I’ve created a slightly different version that shows more clearly what occurred in American church participation from 1990-2010.
Below is a list of reported membership totals for the largest groups, in five-year increments from 1990-2010, also from the Association of Religion Data Archives (ARDA).
The data below are different because they show “membership” figures where the previous was reported “attendance.” For some groups the totals are very close and for others not close at all. (Please see the “Notes” at bottom). But there is only one major discrepancy, and overall the data show the same trend.
Change in U.S. Church Membership, 1990-2010 (negative in red)
Source: ARDA databases, http://www.thearda.com/denoms/Families/groups.asp
Several important changes have been occurring in American religion over the past half-century. While the figures here only cover 20 years of that period, the trend depicted is consistent with what has been happening since the 1960s.
As future posts based on different data will show, the trend also seems to be continuing in the years since 2010, with a few twists.
The fact that religious growth in America, in terms of sheer numbers, is taking place substantially among Catholics and within evangelical Protestant groups is not news to anyone who studies religion nor, I would imagine, to anyone in the funeral business.
As the chart shows, Catholic growth appears to dwarf that of the other groups—but this chart shows “membership” which in the Catholics’ case may be defined by quite different criteria than their actual attendance. (See below).
However, on yesterday’s chart reporting attendance percentage and actual changes, the Catholic Church’s reported increase of 5,541,889 adherents is still larger than that of the 25 groups ahead of it combined (5,327,765).
Notes:
-
Getting accurate participation reports from membership organizations is notoriously difficult, and churches are no exception. The tendency is to overestimate membership through infrequent trimming of the rolls. And for this table, in order to show year-by-year changes, one finds that only membership—rather than attendance—numbers were collected.
-
Researchers overcome the reporting obstacle by going to the other side of the equation and surveying people as to their religious activities, then extrapolating those answers to give a picture of the overall population. Future posts here will show survey results from that angle.
-
A few larger religious groups, including Black Protestant churches and the various Jewish bodies, are missing from the tables because their attendance and membership data over time are not included in the ARDA databases. There are other surveys which show changes in participation for other religious groups, which I will include in an upcoming post.
